Configure GPU autoscaling for Kubernetes
If you manage GPU-intensive workloads with fluctuating traffic in a Kubernetes cluster, you can configure the Kubernetes Event-Driven Autoscaling (KEDA) component to automatically scale your GPU resources based on real-time demand.
With such a setup, you’ll ensure optimal performance and cost efficiency of your application.
Gcore Managed Kubernetes includes native autoscaling based on CPU and memory only. To scale your workloads based on GPU utilization, you must manually install and configure KEDA.
Step 1. Create a Kubernetes cluster
Add a new Managed Kubernetes cluster with a Bare Metal worker pool:
-
In the Gcore Customer Portal, navigate to Cloud > Kubernetes.
-
Click Create Cluster.
-
Select a region—the location of the data center where your cluster will be deployed.
-
Select the Kubernetes cluster version: v.1.28.6 or higher.
-
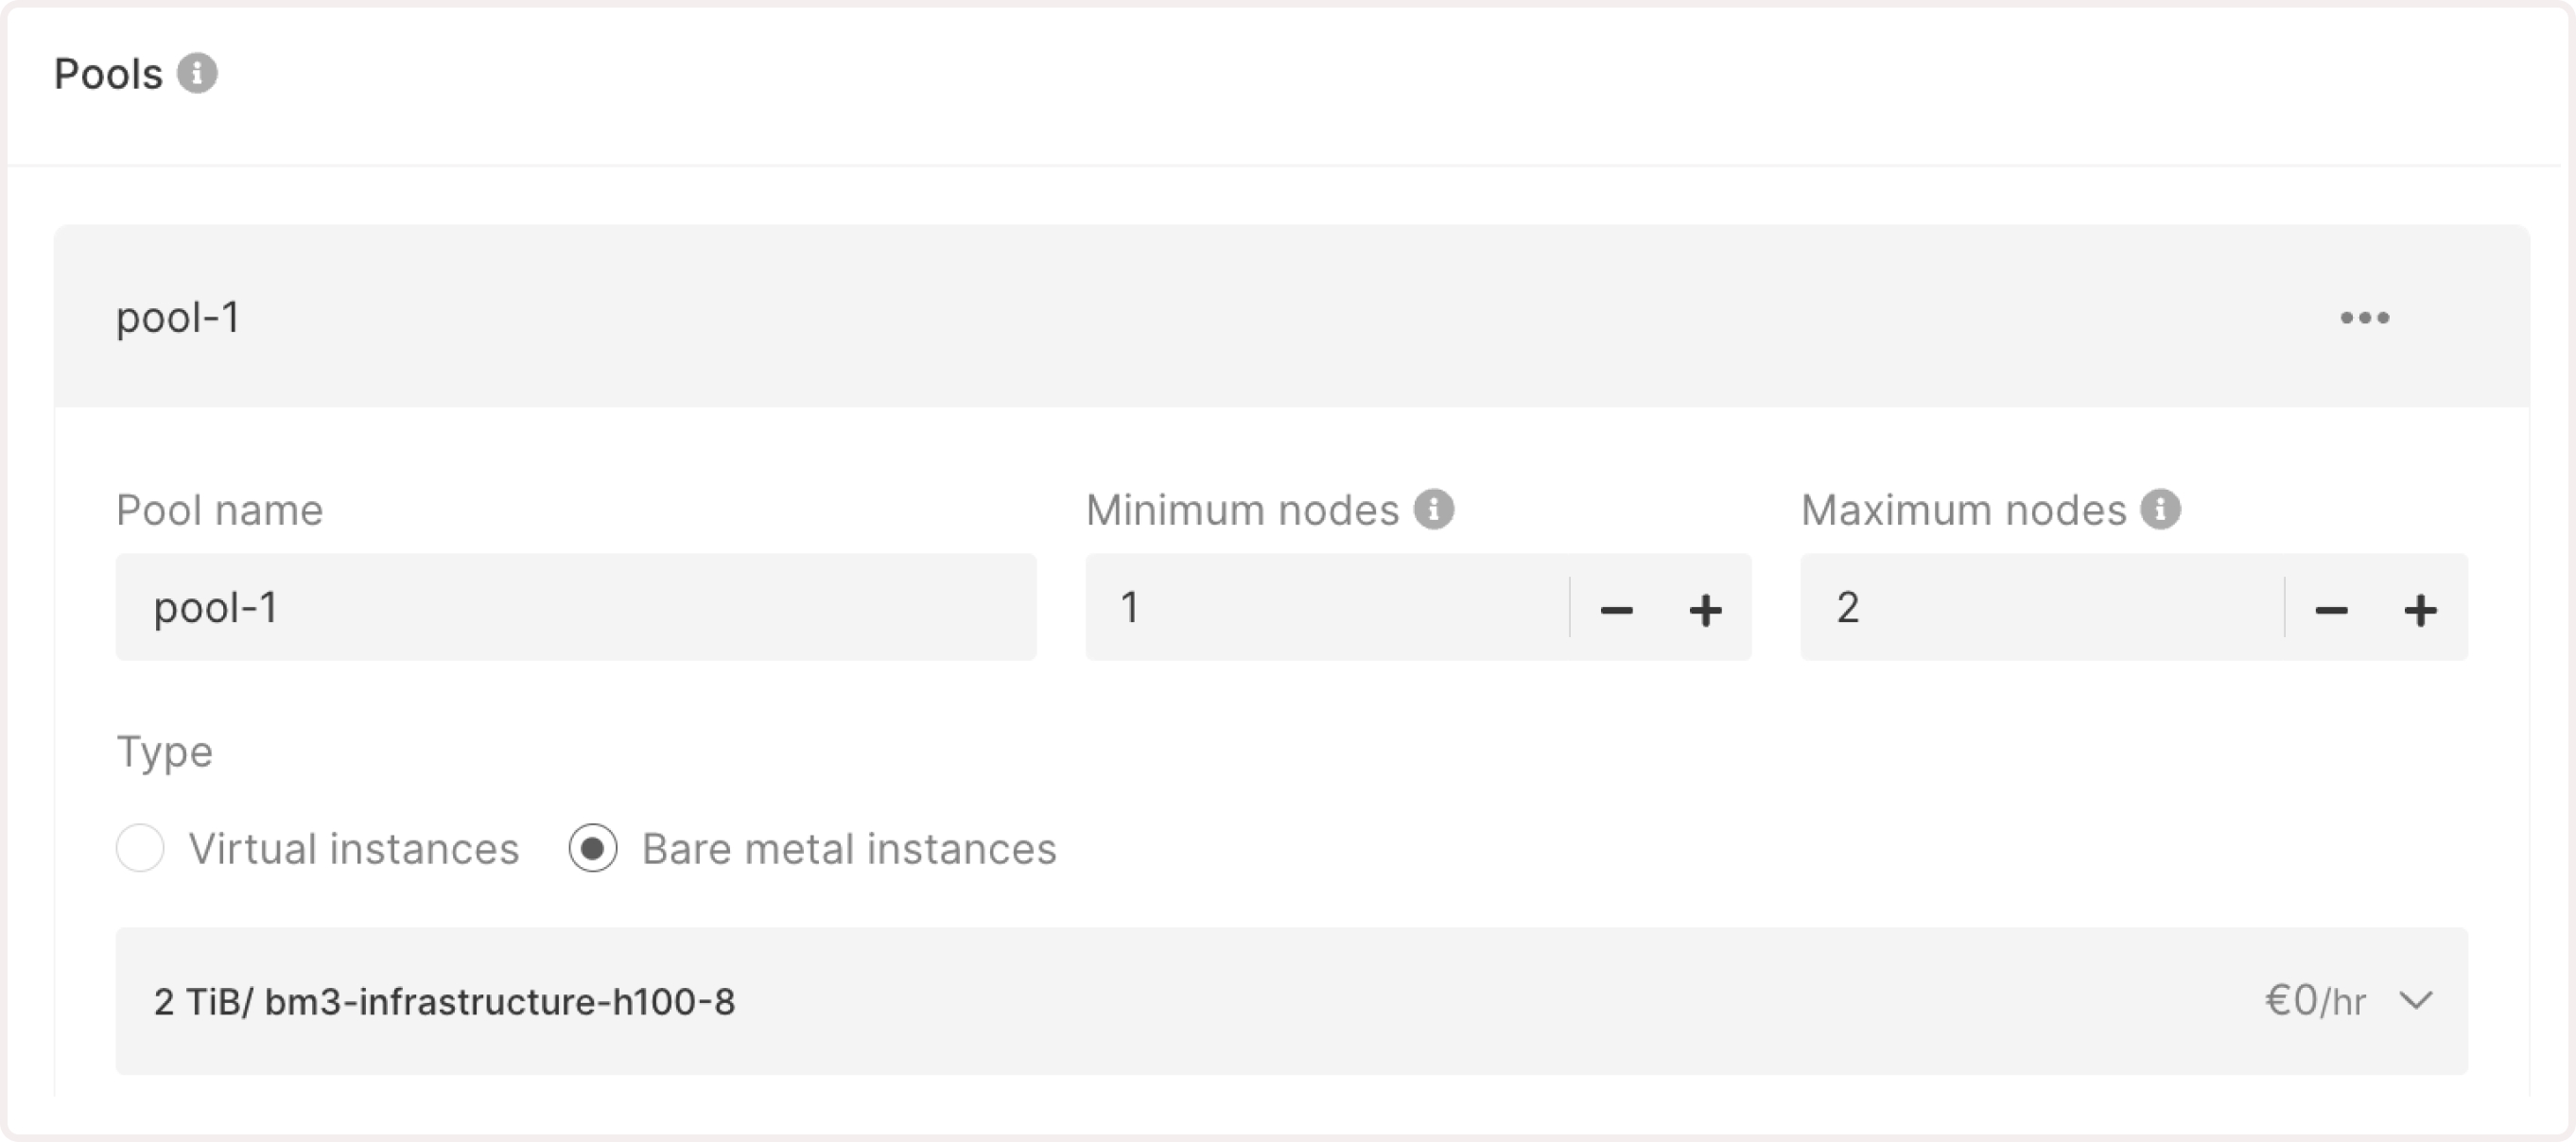
Configure Bare Metal pools:
- Pool name : Enter a unique and descriptive name for your resource pool.
- Minimum nodes and Maximum nodes : Specify how many nodes can be allocated to the pool during traffic fluctuations. The maximum number of pods must be greater than the minimum, allowing the system to scale up in response to increased demand.
- Type : Choose Bare Metal instances.
- Infrastructure : Select the needed GPU-optimized flavor. You need to add at least one node with GPU support to the worker pool.
-
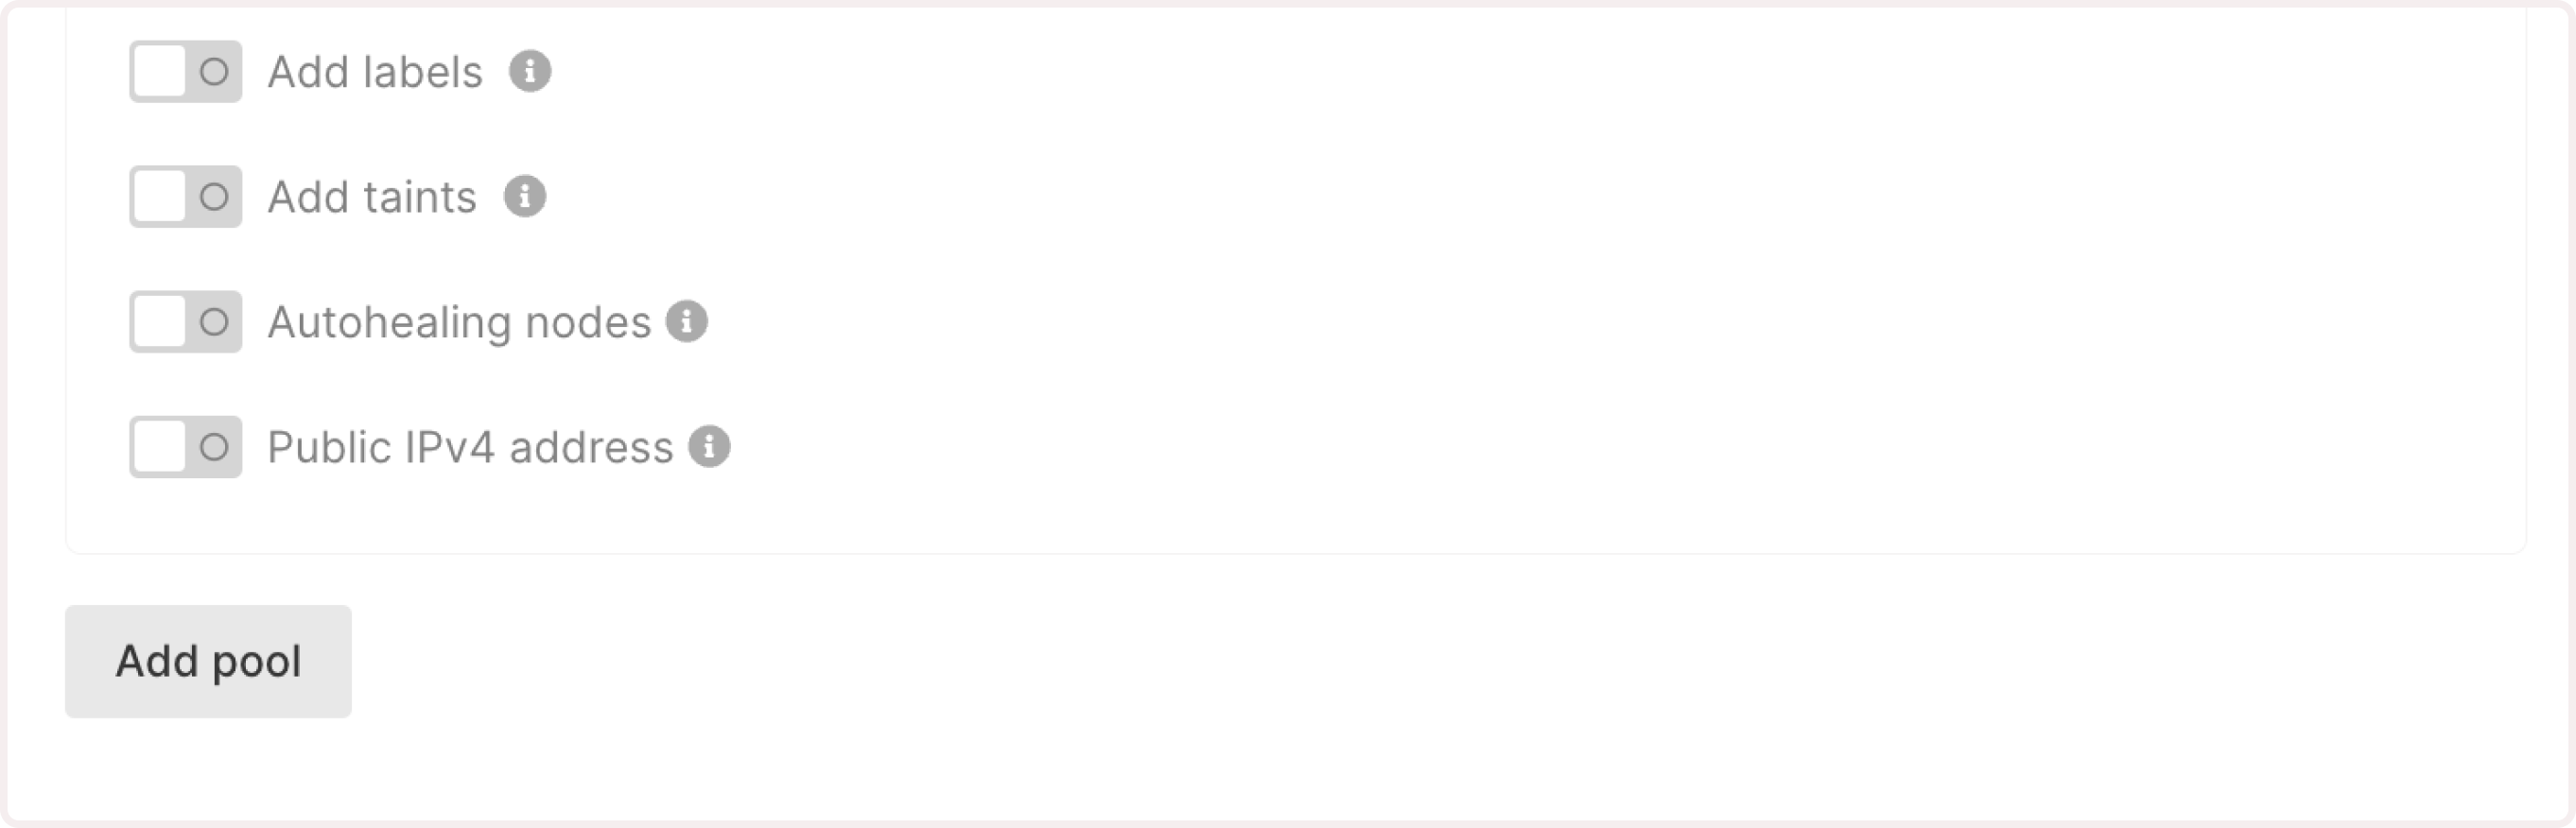
(Optional) Add labels to include additional information about your nodes. You can also specify taints, which are special conditions that define which Kubernetes pods can run on these nodes.
-
Disable the Autohealing nodes toggle.
-
(Optional) Enable the Public IPv4 address option to assign public IPv4 addresses to cluster nodes.
-
If you need to add more pools, click Add pool and configure it according to the previous steps.
- Continue configuring the cluster by following the instructions from Step 5: Select the CNI provider in the Create a Kubernetes cluster guide.
Step 2. Verify your Kubernetes configuration
-
In the Gcore Customer Portal, navigate to Cloud > Kubernetes.
-
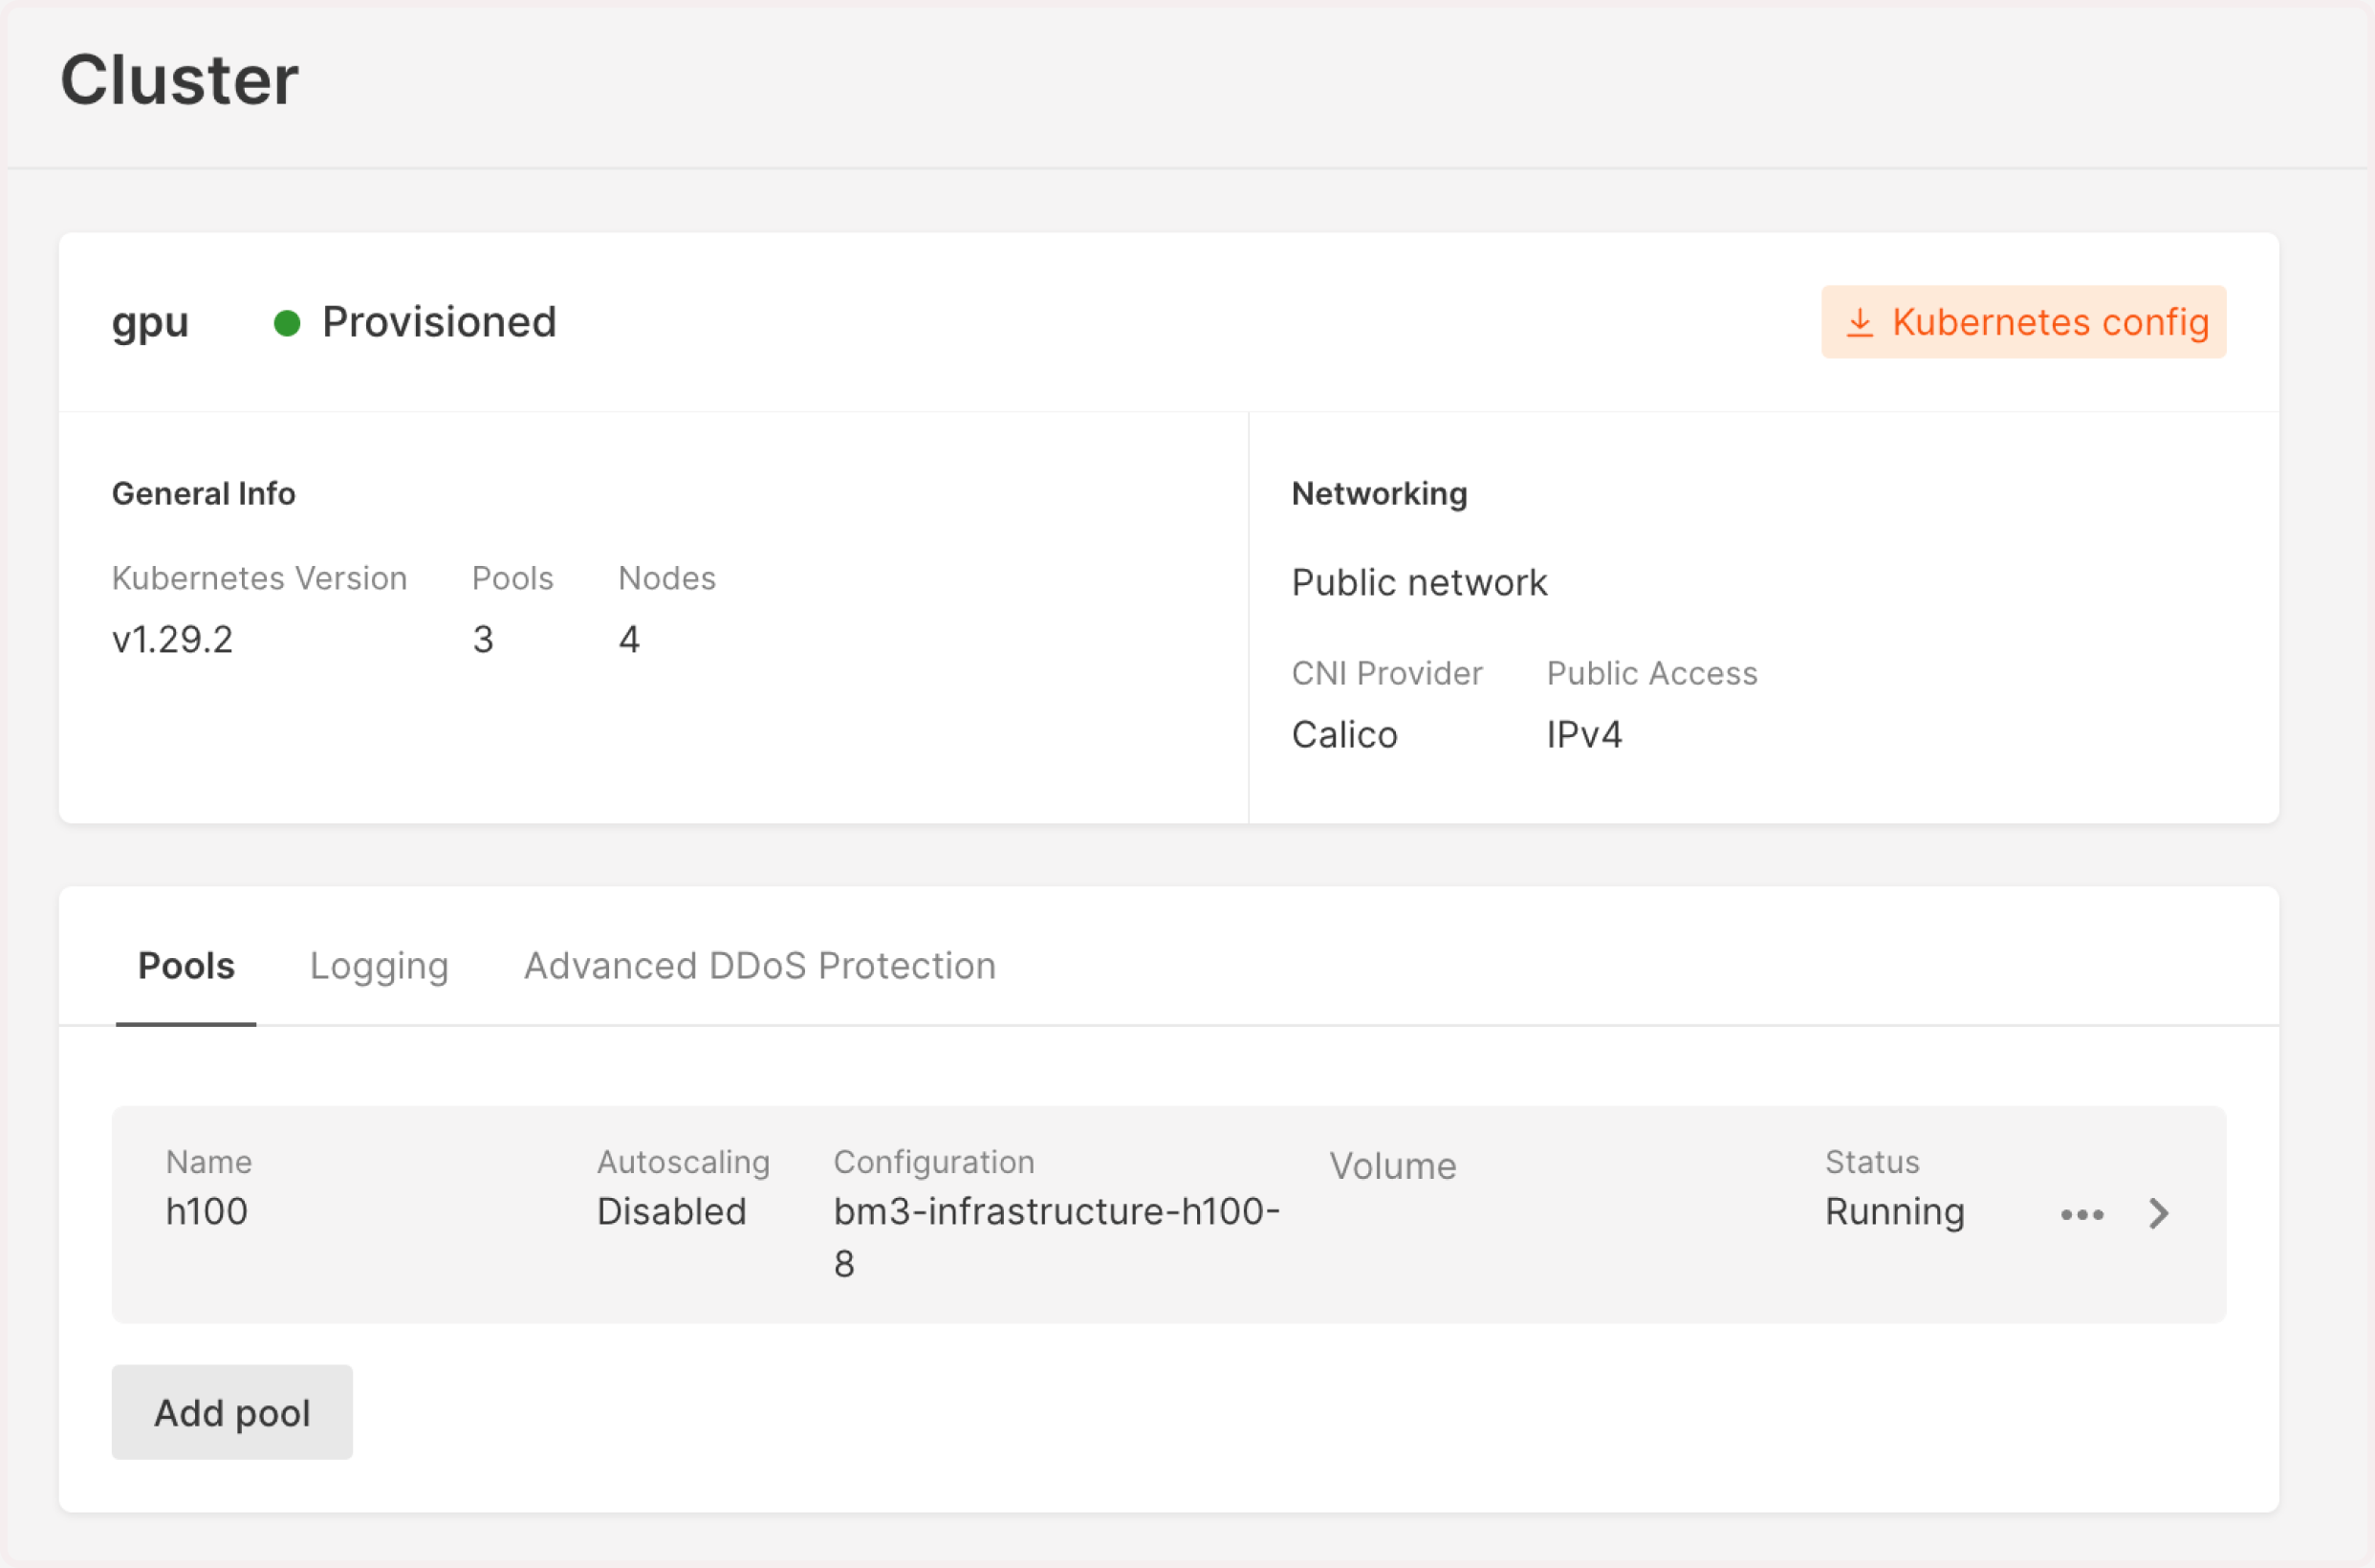
Find the cluster you’ve created in the previous step and click its name to open it.
-
Check the pool status—it should be Running. If you see Scaling up, wait until all resources are allocated and the cluster is ready to use.
-
Download the .config file by clicking Kubernetes config in the top-right corner of the screen.
- Export Kubernetes configuration locally:
- Verify that the created node is ready and correctly configured by running the following command:
Here’s an example of the expected result:
Step 3. Install GPU Operator
Use Helm package manager to install the GPU Operator that’ll manage your resources. If you don’t have Helm, install it according to the official instructions.
To install the GPU Operator:
- Add the NVIDIA Helm repository and update it as follows:
- Install the GPU Operator with the required configurations for your Kubernetes version:
- For Kubernetes 1.28.x:
- For Kubernetes 1.29.x:
Step 4. Verify GPU allocation
- Verify that GPUs have been allocated correctly. The number of GPU nodes in
nvidia.com/gpushould comply with the number specified in the Bare Metal flavor.
- Check the status of the Kubernetes pods–it should be READY.
Here’s an example of the expected result:
Step 5. Run test CUDA pod
Run a test GPU application to verify that the GPU resources in your Kubernetes cluster are properly configured and accessible. Follow the instructions from the official NVIDIA guide: Verification: running sample GPU application.
Step 6. Install KEDA for GPU autoscaling
Install and configure the Kubernetes Event-Driven Autoscaling (KEDA) component for your Managed Kubernetes cluster.
- Add the KEDA Helm repository:
- Update the repository to include any new Helm charts:
- Install KEDA into its own namespace:
Step 7. Install kube-prometheus-stack
To collect and visualize metrics from your Kubernetes cluster, install the kube-prometheus-stack integrated with Prometheus and Grafana.
-
Add the Prometheus Helm repository:
helm repo add prometheus-community https://prometheus-community.github.io/helm-charts -
Update the repository:
helm repo update -
Inspect the default values for the kube-prometheus-stack:
helm inspect values prometheus-community/kube-prometheus-stack > values.yaml -
Create the values-overrides.yaml file that contains additional configurations for the GPU operator:
- Install kube-prometheus-stack with the specified configurations:
To enable GPU metric scraping in Prometheus, you must override some default configurations and explicitly define a job that scrapes DCGM metrics from the gpu-operator namespace.
Step 8. Create autoscaling configuration
Define your GPU workload and configure autoscaling using KEDA with Prometheus-based GPU utilization metrics.
Here is an example configuration:
The metric DCGM_FI_DEV_GPU_UTIL represents the real-time utilization of GPU cores. This is collected by the nvidia-dcgm-exporter, which is part of the GPU Operator setup.
You may adjust the query expression or choose other metrics depending on your use case.
Tip
This autoscaling configuration is based on the DCGM_FI_DEV_GPU_UTIL metrics (GPU utilization). However, you can use any of available metric from DCGM exporter.
Customize the highlighted values:
- workload-name: Enter a unique name that identifies your workload. Make sure that you use the same value in all name fields.
- app-URL: Specify the location of your application. For example, a Docker image.
- allocated-number-of-GPUs: Specify how many GPUs you need. For example, 8.
- [“/usr/bin/sample-command”]: Enter the command your container should run at startup.
- [“—argument-1”, “-argument-2”]: Provide any arguments that should be passed to the command.
- number-of-replicas: Provide the minimum and maximum number of workload copies the system will create during traffic fluctuation.
- metrics-name: Enter a unique-phrase-that-distinguishes-your-metrics
- threshold-number: If the number is reached, the system creates a new workload. For instance, “60”.
Step 9. Check the results
After an application with the GPU workload is deployed, Keda creates a Horizontal Pod Autoscaler (HPA) for this workload and injects the value of GPU utilization from Prometheus as an external metric.
- To get real-time information about the HPA, run
k get hpa -w.
You should get an output like this:
Because there are 8 GPUs per server, the system has spun up eight pods.
After scaling by the number of GPUs, you’ll notice that there are some pending pods created by the HPA. The autoscaler will trigger the addition of new nodes because the cluster is out of free GPUs.
- Fetch the events:
k get events -w.
You should get an output like this:
Wait until the node is provisioned, which might take up to 20-25 minutes.
- Check all pods within your cluster:
k get pods.
You should see something like this:
8 pods are running (there are 8 GPUs per server), and several pods have a Pending status as they wait for the provisioning of a new node.
After the new node is provisioned, the system will create new pods. In the end, you’ll have the number of pods you’ve specified in the maxReplicaCount in Step 8.
Info
After provisioning nodes, it might take up to five minutes for the Nvidia GPU resources to be distributed and managed in the Kubernetes cluster.
- Check the list of nodes and related information:
k get nodes.
You’ll get the list of nodes and their statuses:
- Double-check the HPA status:
k get hpa.
You should see something like this:
When the utilization metric crosses the threshold (e.g. 60%), KEDA creates new pods up to the maxReplicaCount limit.
If all GPUs are in use, and there are not enough available resources, Kubernetes will keep the pods in Pending state.
Cluster Autoscaler (enabled by default in Gcore Managed Kubernetes) will then provision new nodes based on resource demand.
Once the new node is ready and GPUs are initialized (which might take 5–10 minutes), the pending pods will start running.